背景
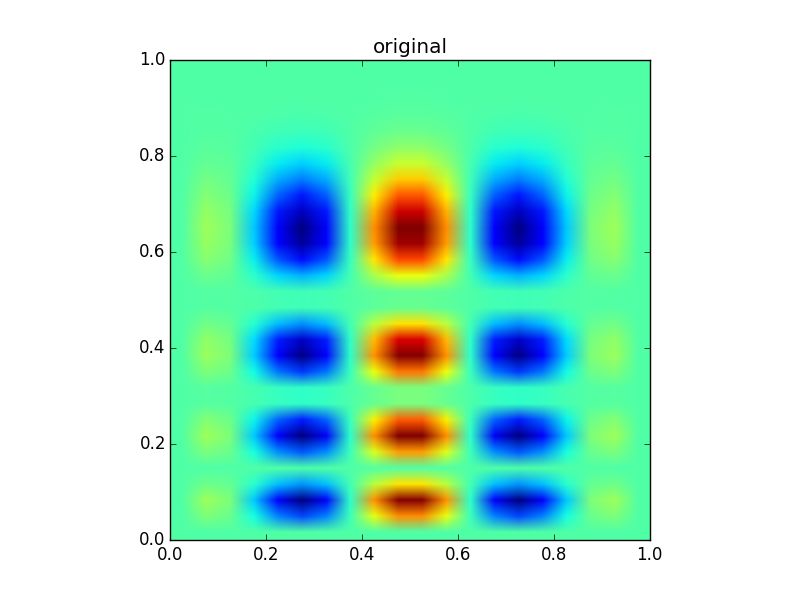
因为一个程序中需要保存的数据太大,所以需要进行采样,保存稀疏网格上的值。在计算完成后,返回原来密集网格上的值。本来使用的是Scipy.interpolate.griddate,效率十分低。
后来查阅相关文档,发现Scipy提供了两种插值模式,分别对应矩形网格和非结构网格,前者效率更高。而对于我的问题,结构网格完全适用。
文档
class scipy.interpolate.interp2d(x, y, z, kind=’linear’, copy=True, bounds_error=False, fill_value=nan)
Interpolate over a 2-D grid.
x, y and z are arrays of values used to approximate some function f: z = f(x, y). This class returns a function whose call method uses spline interpolation to find the value of new points.
If x and y represent a regular grid, consider using RectBivariateSpline.
Parameters :
x, y : array_like
Arrays defining the data point coordinates.
If the points lie on a regular grid, x can specify the column coordinates and y the row coordinates, for example:
x = [0,1,2]; y = [0,3]; z = [[1,2,3], [4,5,6]]
Otherwise, x and y must specify the full coordinates for each point, for example:
x = [0,1,2,0,1,2]; y = [0,0,0,3,3,3]; z = [1,2,3,4,5,6]
If x and y are multi-dimensional, they are flattened before use.
z : array_like
The values of the function to interpolate at the data points. If z is a multi-dimensional array, it is flattened before use. The length of a flattened z array is either len(x)*len(y) if x and y specify the column and row coordinates or len(z) == len(x) == len(y) if x and y specify coordinates for each point.
kind : {‘linear’, ‘cubic’, ‘quintic’}, optional
The kind of spline interpolation to use. Default is ‘linear’.
copy : bool, optional
If True, the class makes internal copies of x, y and z. If False, references may be used. The default is to copy.
bounds_error : bool, optional
If True, when interpolated values are requested outside of the domain of the input data (x,y), a ValueError is raised. If False, then fill_value is used.
fill_value : number, optional
If provided, the value to use for points outside of the interpolation domain. If omitted (None), values outside the domain are extrapolated.
例子
1 | import numpy as np |
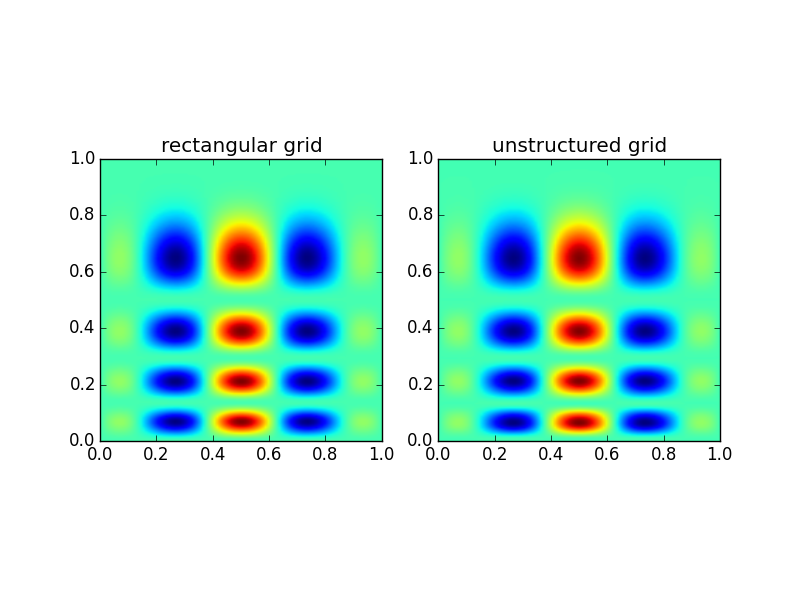
计算时间对比:
- 矩形网格(interp1):0.000456 s
- 非结构网格(interp2):0.098047 s
可见差别非常大,当原始网格更多的时候,对比就越明显。